
**This segment has been discontinued
Click here to access the Expatalachians COVID-19 Dataset (Updated 28 April 2020)
If you’re interested in contributing to a collaborative project on tracking COVID-19 in Appalachia, either through data collection, improved statistical analysis, or mapping, please send an email to nicholas@expatalachians.com
COVID-19 in Appalachia Tracker – April 28, 2020
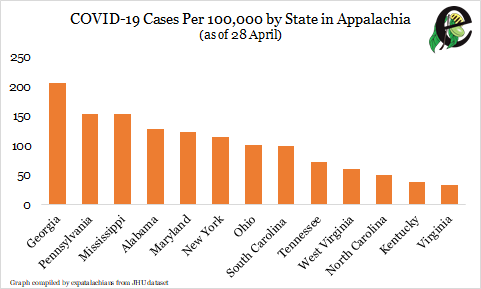
As of 28 April, Appalachia had 29,129 confirmed COVID-19 cases, with 117 out of every 100,000 people testing positive for the virus. On the same date, it also had 1,279 COVID-19 deaths, or a case fatality rate of 4.39 percent. However, cases were distributed unequally across the region, with more cases in northern and southern Appalachia and relatively few in central Appalachia. Continuing trends we’ve seen over the past month or so, outbreaks in southern states like Georgia has increasingly gained on that of northern states like Pennsylvania. For the most up-to-date dataset on COVID-19 in Appalachia, click here.
Appalachia Isn’t a Monolith. COVID-19 Proves It. – April 21, 2020
It’s been said a million times: Appalachia is often presented as a monolith. From presenting it as uniformly white, rural, and poor to conceiving of the coalfields as the “real Appalachia,” writers have often made a vast, diverse area seem like it’s all the same. In fact, Appalachia stretches from the southern New York foothills to the Atlanta suburbs and is home to 25 million people living in 13 different states in all kinds of situations.
Nothing underlines Appalachia’s regional diversity—and inequality—quite as starkly as COVID-19. Although the coronavirus is neutral as to who it infects, factors like geography, race, class, and political leadership have all shaped how the virus has spread throughout the region. While some areas have so far avoided the brunt of COVID-19’s impact, others are experiencing dramatic outbreaks requiring intervention.
As of April 18, Appalachia had 20,671 reported COVID-19 cases (about 83 infections per 100,000 people) and 765 deaths, about 3.7 percent of all people infected. As a whole, Appalachia’s outbreak is relatively small compared to the entire U.S., which reported 234 infections per 100,000 people and a 4.6 percent death rate the same day. However, if one digs down to the state and county level, it’s clear that some Appalachian communities have already been ravaged by the disease, and the situation may only be getting worse. To read more, click here.
COVID-19 in Appalachia Tracker – April 14, 2020
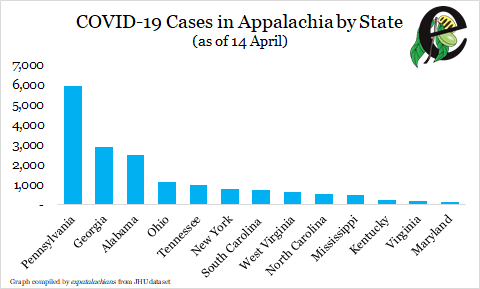
As of April 14, Appalachia had 17,153 COVID-19 cases, a 57% increase over the previous week. The region also had 548 COVID-19 related deaths, a 100% increase over the previous week. Continuing trends from previous weeks, Appalachian Pennsylvania, which includes portions of post-industrial northeast Pennsylvania near the US epidemic center in New York, led the region in number of cases (5,926), with almost twice the number as the state with the next most cases, Georgia (2,916).
By virtue of its much larger caseload, Appalachian Pennsylvania also leads the region in number of deaths (156), but has a significantly lower case fatality rate (CFR), 2.63%, than the regional average of 3.19% (the US was hovering just under 4% this past week). By contrast, Georgia and Kentucky both had CFRs around 3.5% and New York and North Carolina around 4.5%. Ohio, a state otherwise renowned for its COVID-19 response, led among Appalachian CFRs (5.89%), accounting for over 12% of all Appalachian COVID-19 deaths, despite comprising only 6.63% of all cases. As best as I can tell, this is attributable to a cluster of deaths linked to nursing homes around Youngstown (Mahoning, Trumbull) and an ongoing outbreak at Elkton federal prison in Columbiana County that has killed eight prisoners.

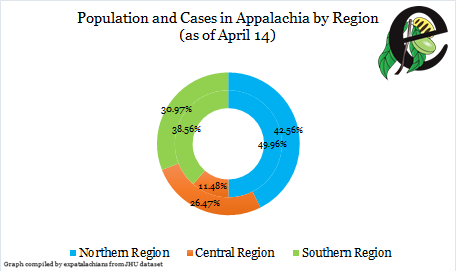
As always though, it’s important to drill down to particular areas to ensure that the more populated and urbanized northern and southern areas of the region aren’t crowding out the less densely populated central coalfields in absolute terms. At least as far as the JHU dataset is concerned, this still isn’t the case. As illustrated in Figure 3, which depicts Central Appalachia’s share of regional population (outer ring) vs. its share of COVID-19 cases (inner ring), Central Appalachia has far fewer recorded cases than its population would indicate. Despite comprising slightly less than a third of the region’s population, Central Appalachia is home to just over 10% of its confirmed COVID-19 cases. Of course, the region’s less developed health infrastructure may mean testing in more rural areas may still be an issue.
Nevertheless, central Appalachian metro areas like Knoxville and Winston-Salem each have more than 100 cases, and some rural counties, like Adair in Kentucky and Grundy in Tennessee, have reported alarmingly high infection rates compared to their smaller populations.
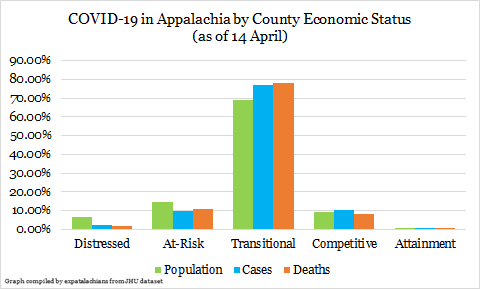
Finally, in addition to analyzing the region geographically, it is also worth looking at COVID-19 cases and deaths in light of socioeconomic indicators. Each year, the Appalachian Regional Commission ranks each Appalachian county against national economic indicators and assigns it one of five statuses. Statuses range from “Distressed” (worst 10% of all US counties economically) to Transitional (middle 50% of all US counties economically) to Attainment (top 10%. Although many of Appalachia’s Distressed counties are clustered in the central Appalachian coalfields, types of each county can be found throughout the region.
Looking at these different categories by COVID-19, as illustrated in Figure 4, illuminates a few trends. Most notably, transitional counties, which make up 68% of Appalachia’s population, also make up a disproportionate number of its cases (76%) and deaths (77%). Competitive counties, which make up about 10% of the regional population, also have slightly more cases than their population would indicate (10.18%), although slightly fewer deaths (8.39%). What really stands out in the numbers though is the relative lack of cases compared to population among Distressed and At-Risk counties, which are currently experiencing about 30-50% fewer cases than their population size might predict.
Although hypothetical, one could imagine a situation wherein these more economically counties might attract less travel than their more competitive counterparts, keeping cases down at least for the moment. Meanwhile, transitional counties might be stuck in an intermediate position whereby they have attracted enough travel to substantially seed the virus, but lack the more advanced health infrastructure of competitive counties, resulting in their disproportionately high death rates.
Tracking Coronavirus in Appalachia – April 7, 2020
by Nicholas Brumfield
As of April 7, counties in the Appalachian Regional Commission had 10,913 confirmed COVID-19 cases, representing 2.76% of all cases in the United States, over double the number of cases it had the previous week. The region had also reported 274 COVID-19 related deaths, or 2.16% of all US COVID-19 deaths. This represented an over 300% jump in deaths in the region compared to the week prior.

These large increases can be seen in Figure 1, which shows the number of cases reported on March 31 (in blue) with the increase in cases by April 7 (in orange). Almost all Appalachian areas saw at least a doubling in their number of cases, with a major increase noticeable in Appalachian Pennsylvania. Already first among Appalachian areas in terms of COVID-19 cases on March 31, by April 7 Appalachian Pennsylvania’s case load had ballooned from 1,339 cases to 3,834, an over 280% increase.
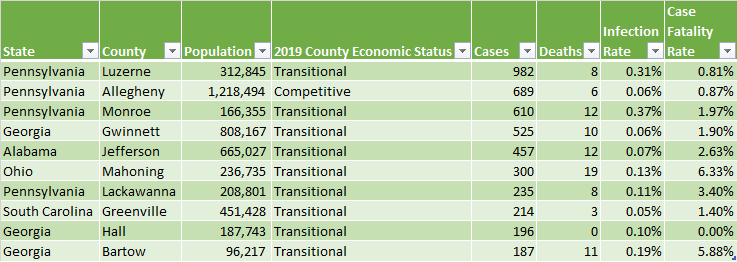
Drilling down to the county-level (see Figure 2) helps elucidate the situation. While one might expect the Pittsburgh metropolitan area (Allegheny County) to lead the number of cases in Appalachian Pennsylvania by virtue of its size, the areas’s large caseload is actually the result of relatively high infection rates among Appalachian counties in the northeast part of state, including Luzerne (Wilkes-Barre), Monroe, and Lackawanna (Scranton), that are nearer to the US epidemic’s center in New York and New Jersey.

As reflected in wider coverage of COVID-19’s disproportionate effects on the South, other hotspot areas in Appalachia include the Atlanta metro area (Gwinnett County) in Georgia, Birmingham (Jefferson) in Alabama, and Greenville in South Carolina. Birmingham in particular has received media attention recently as a stark example of COVID-19’s disproportionate impact on African-Americans due to the legacies of racism. Aside from Pennsylvania, the only northern county to crack the Top 10 for COVID-19 cases was Mahoning (Youngstown) in Ohio.
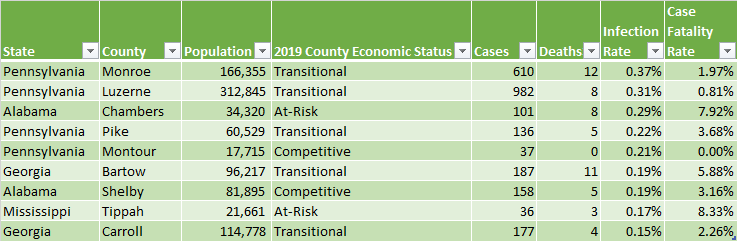
However, lest Central Appalachia’s relatively small population result in it being overlooked in wider regional analysis, it’s worth looking at counties by infection rate as a percentage of population. Even here though, the region thus far seemed to avoid high infection rates, although this must always be tempered by considerations of testing access. None of the Top 10 counties in Appalachia by infection rate are located in the central region, with the most infected central region county being Grundy County (#14, 16 cases, 0 deaths) in Tennessee. West Virginia’s most infected county was Marion (#38, 25 cases, 1 death), while Appalachian Kentucky’s most infected county was Edmonson (#96), with 5 cases.
All told, Central Appalachia had about 2,000 COVID-19 cases, compared with around 4,000 for Southern Appalachia and around 4.800 for Northern Appalachia. However, this shouldn’t be taken as evidence that Central Appalachia has evaded the outbreak just yet though. As has been the case historically, it may just be the case that COVID-19 has yet to hit rural areas.
Tracking Coronavirus in Appalachia – March 31, 2020
by Nicholas Brumfield
As of March 31, counties in the Appalachian Regional Commission had 4,677 confirmed COVID-19 cases, representing 2.49% of all cases in the United States. The region had also reported 90 deaths, or 2.33% of all fatalities in the United States. As a whole, ARC counties had a death rate of 1.92%, compared to 2.06% nationally. However, significant differences within the region remained, as can be found in our new county-level COVID-19 in Appalachia dataset (to be updated weekly).
Many parts of Appalachia have seen considerable increases in cases since our last report on March 25, with the ARC portions of all regional states experiencing at least a doubling of cases and some observing much larger increases. Appalachian Ohio saw a 22-fold increase from 13 cases to 289, while Tennessee and North Carolina saw 17-fold and 13-fold increases respectably. In absolute terms, Appalachian Pennsylvania saw the greatest increase, adding 1,056 cases, with Georgia (+607) and Alabama (+441) also leading among Appalachian areas.
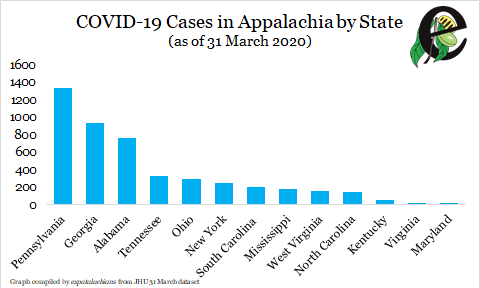
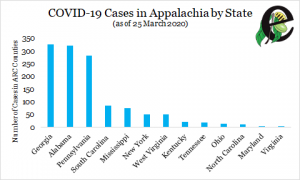
Figure 1 – COVID-19 Cases in Appalachia by State
These developments have produced some changes in how the outbreak looks across Appalachian states, although some trends have remained. Appalachian Pennsylvania’s large addition of cases resulted in it becoming the ARC area with the most cases, but Pennsylvania, Georgia, and Alabama continue to lead states by number of cases. Of the top 10 counties by number of cases in the region, eight were in those states, mostly around the Pittsburgh, Atlanta, and Birmingham metro areas, but also around smaller like Wilkes-Barre, Pennsylvania and Huntsville, Alabama.
Also of note is the rise of Appalachian Tennessee and Ohio, which were among the bottom half by number of cases last week, to 4th and 5th among ARC areas respectively.
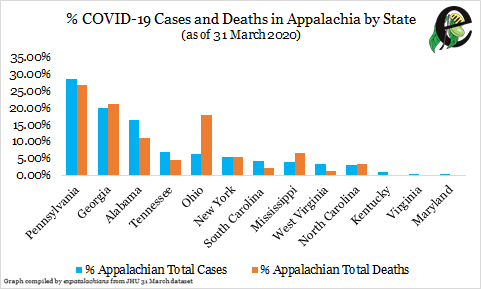
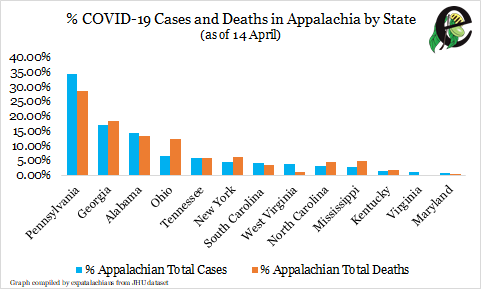
Figure 2 – Percentages of Total COVID-19 Cases and Deaths in Appalachia by State
Looking at death rates, a somewhat different picture emerges. As illustrated in Figure 2, Ohio notably has a much higher proportion of deaths in the region (16 of 90, 17.78 percent of all regional deaths) than one might expect from its small case proportion (289, 6.18 percent). This is reflected in Appalachian Ohio’s much higher death rate than the regional average (5.54 percent vs. Appalachia’s 1.92 percent).
Tracking Coronavirus in Appalachia – March 25, 2020
by Nicholas Brumfield
As coronavirus continues to spread throughout the world, expatalachians has started to track reported cases in Appalachia to foster informed discussion about the disease in the region. Although we won’t be able to share base-level county data until next week, we wanted to share some of the initial aggregate findings.
As illustrated by Figure 1, while Central Appalachia has had relatively few cases as of yet, southern and northern Appalachian states like Georgia, Alabama, and Pennsylvania now have several hundred cases a piece. This could possibly be due to large cities in those states’ Appalachian regions, like Pittsburgh, Birmingham, and Atlanta exurbs.
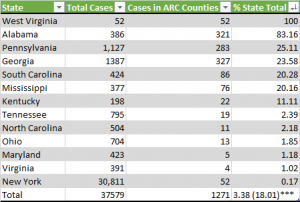
However, as Figure 2 shows, the Appalachian portions of Alabama, Pennsylvania, and Georgia also make up a significant component of the COVID-19 outbreak within those states, with a staggering 83 percent of Alabama’s total case count coming from the state’s northern Appalachian region. Any conclusions from this data must be preliminary though, as testing remains limited (most states have not tested more than 10,000 people) and uneven.
All told, as of the evening of March 25, Appalachia had around 1,271 confirmed COVID-19 cases, or about 3.4 percent of all cases in states with counties in the Appalachian Regional Commission and about 2 percent of all cases in the United States.
As a final note though, if one estimates regional infection rates without New York, which, with 30,811 cases mostly clustered in New York City, makes up both 80 percent of cases in ARC states and almost half of all US cases, the picture looks somewhat different. Excluding New York, Appalachian counties make up about 18 percent of cases in ARC states.
If you’re interested in contributing to a collaborative project on tracking COVID-19 in Appalachia, either through data collection, improved statistical analysis, or mapping, please send an email to nicholas@expatalachians.com
*Due to an unfortunate saving error, I lost the county-level data I had compiled that forms the basis of the aggregate data discussed here. I hope to have compiled a new dataset next week.
**As the only state located completely within Appalachia, West Virginia’s percentage of cases within the region will always be 100
***Percentage of ARC state cases within Appalachian counties if New York is excluded in parentheses